 Chat with us on WhatsApp


A Guide to Advanced Analytics and Data-Driven Marketing |
|||||||||||||||||||||||||||||||||||||||||||||||||||
|
by David Dwyer on 12/08/2024 |
|||||||||||||||||||||||||||||||||||||||||||||||||||
|
Data is power in this digital age. However, how can you transform raw data into actionable insights that drive your marketing success? Introducing advanced analytics and data-driven marketingw. This strategy is like a crystal ball that reveals exactly what your customers want and how they behave online. In this helpful guide, we’ll help you understand everything about data-driven marketing. From understanding key metrics to implementing advanced analytics techniques, we’ll show you how to make informed decisions that improve your bottom line. Ready to elevate your marketing game with data-driven strategies? Read on and discover how Inspire Digital can help you leverage advanced analytics to drive success!
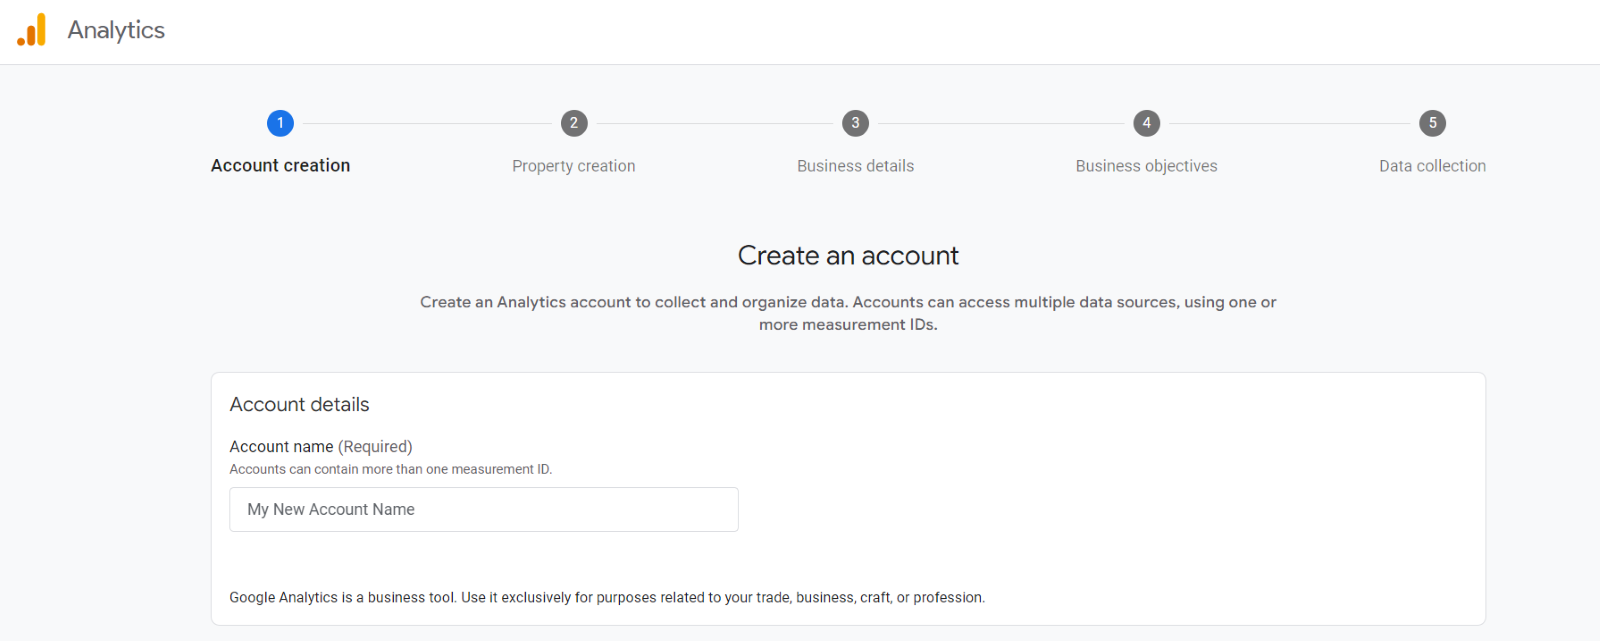
Introduction to marketing analyticsMarketing analytics is the process of collecting and analysing data for companies to understand their audience better, improve their strategies, and ultimately grow their business. By leveraging data, marketers can make informed decisions that enhance campaign performance and ROI. Let’s explore more on the importance of data in marketing and analytics in digital marketing. Importance of data in marketingData is the foundation of modern marketing. When you utilise data, you can be aware of your customer’s behaviour and preferences, allowing you to personalise your strategies effectively. Here are a few key reasons why data is crucial:
Overview of analytics in digital marketingTo perform marketing analytics, you will need a range of tools and techniques to measure, manage, and analyse your marketing performance. Let’s see some of the core components of analytics that can help you collect data from various channels to gain actionable insights.
|
|||||||||||||||||||||||||||||||||||||||||||||||||||
.png)
|
KPI |
Description |
Importance |
|
Website Traffic |
Total number of visitors to your site |
Measures reach and effectiveness of campaigns |
|
Bounce Rate |
Percentage of visitors leaving after one page |
Indicates site engagement and content relevance |
|
Average Session Duration |
Average time spent on the site |
Gauges visitor interest and engagement |
|
Pages per Session |
Average number of pages viewed per visit |
Measures content depth and visitor interest |
|
Conversion Rate |
Percentage of visitors completing a desired action |
Indicates effectiveness in driving conversions |
|
Cost per Conversion |
Cost to acquire a single conversion |
Measures efficiency of marketing spend |
|
Lead Generation |
Number of new leads generated |
Indicates success in attracting potential customers |
|
Sales Revenue |
Total revenue from marketing campaigns |
Measures overall financial impact of marketing |
|
Customer Lifetime Value |
Total revenue from a single customer account |
Indicates long-term value of customers |
|
Churn Rate |
Percentage of customers who stop doing business |
Measures customer retention and satisfaction |
|
Repeat Purchase Rate |
Percentage of customers making multiple purchases |
Indicates customer loyalty |
|
Net Promoter Score (NPS) |
Likelihood of customers recommending your business |
Measures customer satisfaction and brand advocacy |
Data visualisation and reporting
Effective data visualisation and reporting are crucial to translate complex data into understandable and actionable insights. By presenting data clearly and concisely, businesses can make informed decisions that drive success.
.png)
Creating effective reports
Using data visualisation tools will help you create reports that are informative and engaging. These tools help transform raw data into visual representations, making it easier to identify trends, patterns, and insights.
Tools for data visualisation
According to Harvard Business School, here are the best data visualisation tools for professionals:
- Microsoft Excel (and Power BI): Excel is a versatile tool for data analysis and visualisation. Power BI enhances these capabilities with more advanced features, allowing for interactive dashboards and reports.
- Google Charts: Google Charts offers a wide variety of interactive charts and data tools that integrate seamlessly with other Google services.
- Tableau: Tableau is a powerful data visualisation tool known for its ability to create interactive and shareable dashboards. It’s widely used for its user-friendly interface and robust analytics capabilities.
- Zoho Analytics: Zoho Analytics provides comprehensive data analysis and visualisation tools that help create insightful reports and dashboards.
- Datawrapper: Datawrapper is ideal for creating simple, effective visualisations quickly. It's user-friendly and great for embedding charts into websites and reports.
- Infogram: Infogram excels in creating visually appealing infographics and reports. It’s perfect for marketing and presentation purposes.
Best practices for reporting
Following the best practices for reporting will help you maintain consistency, accuracy, and relevance in your reporting. Mailchimp provides a list of tips so you can ensure your reports are effective and actionable:
- Develop a schedule: Establish a regular reporting schedule to keep track of progress and make timely adjustments. Consistent reporting ensures that data is always up-to-date and relevant.
- Use automated tools: Automated tools can save you time and reduce errors. They can streamline data collection and analysis processes, providing real-time insights without manual intervention. This way, your team can focus on other tasks and priorities.
- Use digital dashboards: Digital dashboards offer a dynamic way to view data in real-time. They are interactive and allow users to drill down into specifics to easily monitor key metrics.
- Choose the right charts for the data: Selecting the appropriate chart type is crucial. For example, use bar charts for comparisons, line charts for trends over time, and pie charts for proportions.
- Focus on your cybersecurity measures: Protecting your data is paramount. Ensure that your reporting tools and processes adhere to robust cybersecurity standards to prevent data breaches and loss.
- Know what KPIs are most important to you: Identify and focus on the KPIs that matter most to your business to make sure your reports are aligned with your strategic goals.
- Ensure your data tools can talk to one another: Integration between data tools is essential for a seamless workflow. Ensure that your tools can communicate and share data effectively to avoid data silos.
- Enable remote access: With the rise of remote work, it's important to ensure that your data and reports are accessible from anywhere. This flexibility allows your team to stay informed and make decisions regardless of their location.
Visualisation techniques
Effective visualisation techniques are essential for transforming complex data into clear, actionable insights. By employing the right methods, businesses can make better-informed decisions, identify trends, and communicate findings more effectively. In this section, we’ll explore the use of dashboards and custom reports, as well as techniques for visualising trends and patterns.
.png)
Dashboards and custom reports
Dashboards are powerful tools that provide a real-time overview of key metrics and performance indicators. They offer a dynamic way to monitor and analyse data, enabling businesses to react quickly to changes and opportunities.
Dashboards can be customised to display the most relevant data for your specific needs to ensure that you always have the most pertinent information at your fingertips.
Creating effective dashboards involves:
- Identifying key metrics: Focus on the most critical performance indicators that align with your business goals.
- Designing for clarity: Use clear, concise visuals that are easy to interpret. Avoid clutter and ensure that the most important information stands out.
- Interactivity: Allow users to drill down into the data for more detailed analysis. Interactive elements like filters and clickable charts enhance the user experience.
Custom reports are tailored documents that provide in-depth analysis of specific data sets. Unlike dashboards, which offer a broad overview, custom reports dive deep into particular areas, offering detailed insights and recommendations.
Creating effective custom reports involves:
- Defining objectives: Clearly outline what the report aims to achieve to make sure that the analysis is focused and relevant.
- Data accuracy: Ensure that the data used is accurate and up-to-date. Reliable data is crucial for drawing valid conclusions.
- Clear presentation: Present the findings in a clear, logical manner. Use headings, subheadings, and bullet points to organise the information.
Visualising trends and patterns
Data reporting isn'tjust about collecting and presenting numbers; it's about telling a story that drives decisions and actions. Visualising trends and patterns in your data is essential to uncovering insights that might otherwise be missed. Here’s how to effectively visualise trends and patterns in your data reporting:
Identifying trends
To make informed decisions, you need to identify trends over time. Trends show how a particular metric has changed, helping you understand whether your strategies are working or need adjustments. Here’s how to do it:
- Line graphs: Perfect for showing changes over time, line graphs help you visualise upward, downward, or cyclical trends in your data.
- Moving averages: These smooth out fluctuations to reveal underlying trends, making it easier to see the bigger picture.
Spotting patterns
Patterns in data can highlight recurring behaviours or anomalies that need attention. Recognising these patterns can lead to actionable insights:
- Heatmaps: Use heatmaps to identify which parts of your website get the most attention. This can inform you about user behaviour and highlight areas for improvement.
- Scatter plots: These are excellent for identifying correlations between two variables. For example, you might spot a pattern between website traffic and conversion rates.
Effective visualisation techniques
Choosing the right visualisation technique is crucial to effectively communicate your findings. Here are some effective methods:
- Bar charts: Use bar charts to compare different categories or groups. They are straightforward and easy to interpret.
- Pie charts: Ideal for showing proportions and percentages, pie charts help you understand the composition of a whole.
- Histograms: These are useful for displaying the distribution of a dataset, showing how often each value occurs.
Using data to drive marketing strategies
In modern marketing, data is a powerful tool that can transform your strategies and drive significant business growth. By harnessing the insights gained from data analysis, businesses can make informed decisions, identify new opportunities, and optimise their marketing efforts for better results.
Let’s explore how to turn insights into action and make data-driven decisions to elevate your marketing strategies.
.png)
Turning insights into action
Data by itself is just raw information. The real power lies in interpreting this data and turning it into actionable insights. Here’s how you can do it:
Identifying opportunities
Data analysis can reveal hidden opportunities that might not be apparent at first glance. By carefully examining trends, patterns, and anomalies, you can uncover areas where your business can grow or improve.
- Market trends: Stay ahead of industry trends by regularly analysing market data. This helps you anticipate changes and adapt your strategies accordingly.
- Customer preferences: Use customer data to understand preferences and behaviours. This can guide your product development, marketing messages, and overall strategy.
- Competitor analysis: Keep an eye on your competitors' performance. Analysing their data can reveal gaps in the market that you can exploit.
Making data-driven decisions
Data-driven decision-making involves using factual evidence to guide your strategies, rather than relying on intuition or guesswork. This approach ensures that your decisions are based on solid information, leading to more effective and efficient marketing efforts.
- Set clear goals: Define what you want to achieve with your marketing campaigns. Clear goals provide a roadmap for data analysis and help you measure success.
- Use relevant metrics: Focus on the KPIs that are important to your business. This ensures that your decisions are based on the most critical data.
- Test and iterate: Implement small changes based on your data insights and measure the results. Continuous testing and iteration allow you to refine your strategies and improve performance over time.
How Inspire can help
At Inspire Digital, we understand the power of data-driven marketing and the impact it can have on your business. Our team is dedicated to helping you harness the full potential of analytics and advanced marketing strategies to drive growth and achieve your goals.
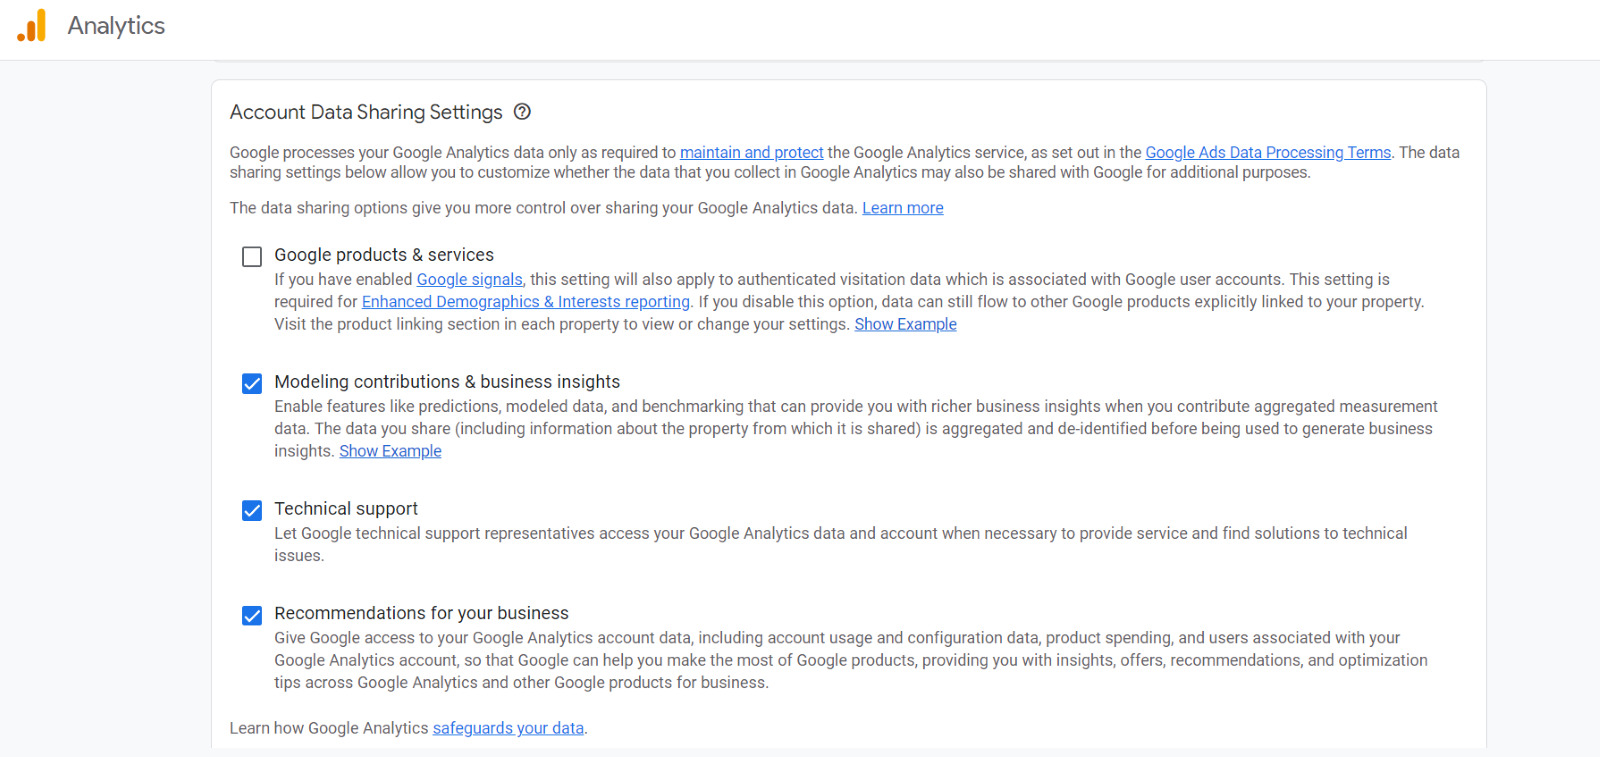
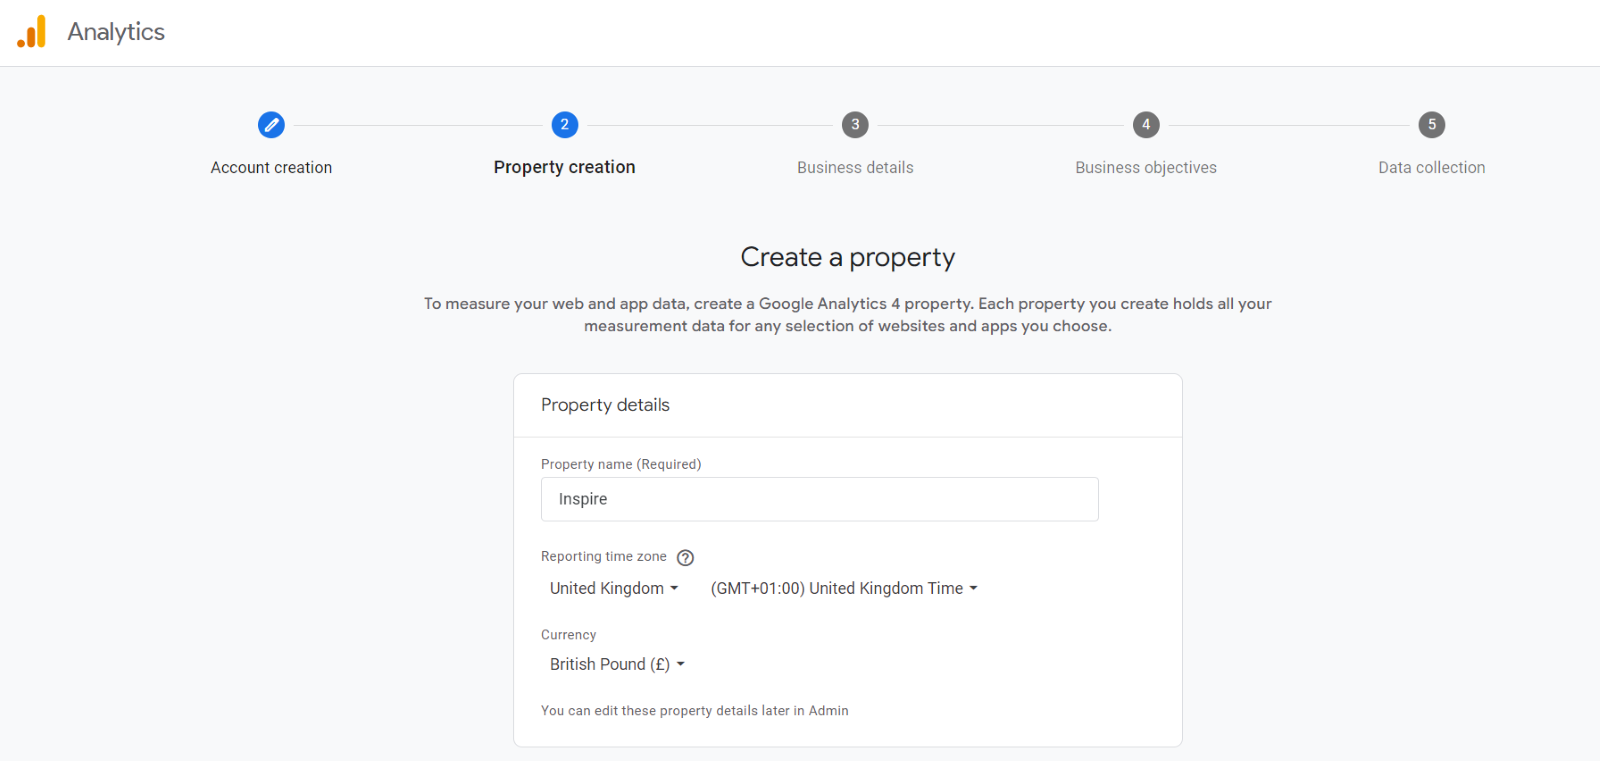
Whether you need help setting up Google Analytics, interpreting complex data, or creating effective marketing campaigns, we are here to guide you every step of the way.
Ready to take your marketing to the next level? Contact us today for a free consultation and let’s explore how our data-driven approach can transform your business. Together, we can unlock new opportunities and achieve lasting success!
Unlike many web design or marketing agencies, we do not run automated software and send you out a long technical Website Review Report on what you or indeed your last developer have missed.
We recognise that the web is evolving at a tremendous pace, one real month is equal to one web year, so what was delivered just a few years ago, may very well be looking tired and dated.
At the four BNI Groups we are members of, we are fully signed up to Givers Gain and offer referral clients 20 minutes of our consultancy time (at no charge).
We cover a range of areas such as "What is the objective of your website?"; "What is your business model?"; "Who is your audience?"; then we can cover User eXperience; Usability; Site Analytics; Search Engine Optimisation (On-Site).
We know the value of both your and our time but we also know that we're keen to build relationships and this approach is the first building block in establishing that mutual trust and respect.


© Inspire Digital 2025
A Scottish Web Services Company
Web Design by Inspire Digital